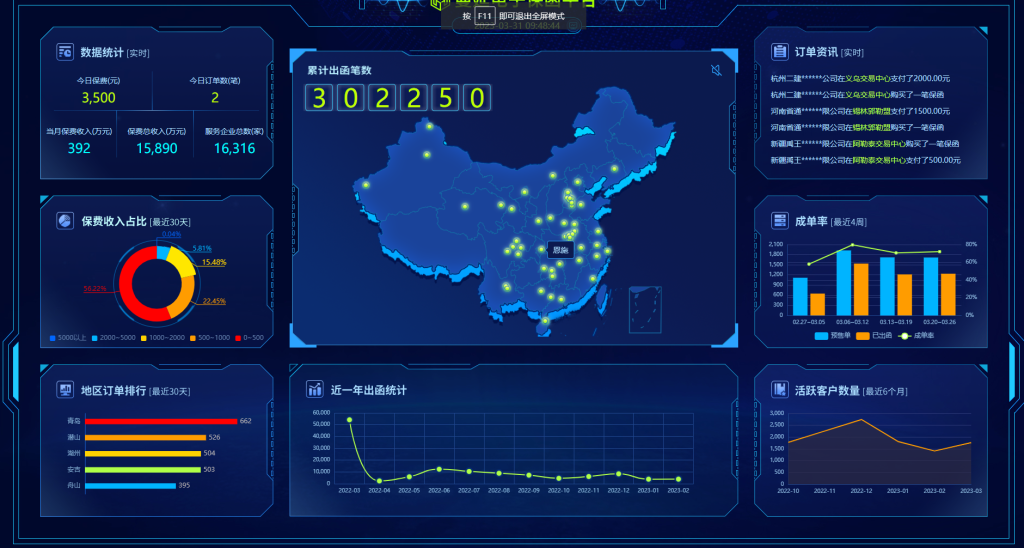
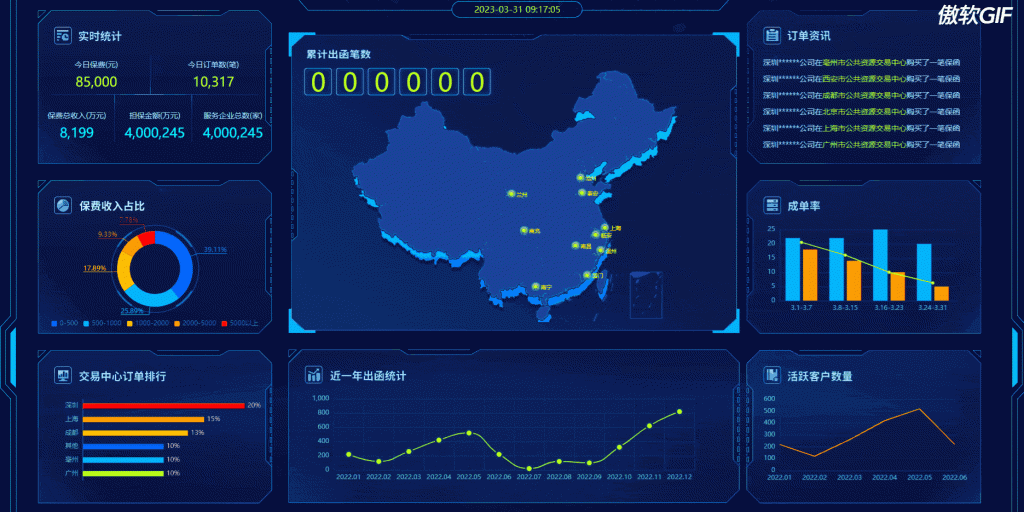
这个也是工作中已经实现过了,拿出来讲解一下,因为是公司项目,所以项目源代码就不分享了,现在看一下实现过程和echarts各配置
正式效果:

动态效果:(点击下面图片新窗口查看gif效果)

1、实时统计动画效果实现方法:
主要是使用了NPM插件,因为有成熟的,就不必在这个上面浪费时间了
npm i vue-count-to
然后使用页面给予起始值和结束值,每次接口更新时,只需更新结束值即可
import countTo from “vue-count-to”;
<countTo :startVal=’起始值’ :endVal=’结束值’></countTo>
2、保费收入占比动画效果实现方法:
这里主要是利用了echarts的饼状图,通过各属性设置达到该效果,配置如下
  timePie = null;
  // 构建饼状
  myChartPie: any;
  drawLine_pie(item: any, list: any) {
    let _data: any = [];
    let colors = [
      { color: "#ff0000" },
      { color: "#ff9c00" },
      { color: "#ffd200" },
      { color: "#00b4ff" },
      { color: "#0066ff" },
    ];
    list.forEach((item: any, index: number) => {
      _data.unshift({
        value: item.ratio,
        name: item.scope,
        itemStyle: { color: colors[index].color },
      });
    });
    this.myChartPie = echarts.init(item as HTMLDivElement);
    let _myChart = this.myChartPie;
    let _option = {
      top: {
        bottom: "20px",
        containLabel: true,
      },
      legend: {
        bottom: -5,
        itemWidth: 10,
        itemHeight: 10,
        selectedMode: false,
        textStyle: {
          color: "#6381AE",
          fontSize: "12px",
        },
      },
      series: [
        {
          name: "保费收入占比",
          type: "pie",
          radius: ["45%", "68%"],
          height: "98%",
          labelLine: {
            length2: 5,
          },
          label: {
            color: "auto",
            formatter: "{d}%\n",
          },
          labelLayout: function (params) {
            const isLeft = params.labelRect.x < _myChart.getWidth() / 2;
            const points = params.labelLinePoints;
            // Update the end point.
            points[2][0] = isLeft
              ? params.labelRect.x
              : params.labelRect.x + params.labelRect.width;
            return {
              labelLinePoints: points,
            };
          },
          emphasis: {
            label: {
              show: true,
              fontSize: "13px",
            },
          },
          data: _data,
        },
      ],
    };
    _myChart.setOption(_option);
}
3、订单排行效果实现方法:
这里主要是利用了echarts的柱状图,通过各属性设置达到该效果,配置如下
myChartBar: any;
drawLine_bar(item: any, list: any) {
    let _y: any = [];
    let _s: any = [];
    const colors = [
      { color: "#ff0000" },
      { color: "#ff9c00" },
      { color: "#ffd200" },
      { color: "#afff48" },
      { color: "#00b4ff" },
      { color: "#0066ff" },
    ];
    list.forEach((item: any, index: number) => {
      _y.unshift({
        value: item.org_name,
        textStyle: {
          color: "#81ACD2",
        },
      });
      _s.unshift({
        value: item.ratio,
        itemStyle: { color: colors[index].color },
      });
    });
    this.myChartBar = echarts.init(item as HTMLDivElement);
    let _myChart = this.myChartBar;
    let _option = {
      grid: {
        top: "20px",
        left: "50px",
        right: "50px",
        bottom: "20px",
        containLabel: true,
      },
      xAxis: {
        show: false,
      },
      yAxis: {
        type: "category",
        inverse: true,
        data: _y,
        axisLabel: {
          formatter: function (params: any) {
            if (params.length > 4) {
              return params.substr(0, 4);
            } else {
              return params;
            }
          },
        },
        axisTick: {
          show: false,
        },
        axisLine: {
          lineStyle: {
            color: "#1C68DA",
          },
        },
        animationDuration: 300,
        animationDurationUpdate: 300,
      },
      series: [
        {
          realtimeSort: true,
          type: "bar",
          label: {
            show: true,
            position: "right",
            color: "#B9B4B4",
            formatter: "{c}",
          },
          barWidth: 10,
          data: _s,
        },
      ],
      animationDuration: 0,
      animationDurationUpdate: 2500,
      animationEasing: "linear",
      animationEasingUpdate: "linear",
    };
    _myChart.setOption(_option);

}
4、地图和金币飞行效果实现方法:
金币是利用了echarts的航线效果,地图背景是设计师给的一张图,然后做到和我echarts控件地图一样大,一开始也是想用echarts的控件绘制,后来发现就算是绘制两层,也无法实现设计师的效果,所以干脆用一样大的图片做背景,然后echarts地图组件只需构造坐标和航线即可,然后金币进钱的声音更加简单了,增加一个是否播放按钮,开启后如果有单进执行播放即可,默认不播放(因为需要手动触发才会有声音)
// 地图构造
  myChartMap: any;
  async drawLine_map(item: any, list: any) {
    const res: any = await axios.get("/chinaMap.json");
    echarts.registerMap("china", res.data);
    this.myChartMap = echarts.init(item as HTMLDivElement, "none", {
      renderer: "svg",
    });
    let _myChart = this.myChartMap;
    const gb = "image://" + require("../assets/latlon.png");
    const jb = "image://" + require("../assets/jb.gif");
    const jb_dh = "image://" + require("../assets/jb_dh.png");

    const effect = {
      type: "effectScatter",
      coordinateSystem: "geo",
      animation: false, //坐标点是否显示动画
      symbol: gb,
      symbolSize: 14,
      data: list.map((item) => {
        return {
          name: item.name,
          value: item.value,
          itemStyle: {
            normal: {
              color: "#ffff00",
            },
          },
          label: {
            show: false,
            color: "rgb(255, 255, 0)",
            formatter: "{b}",
            offset: [20, 0],
            fontSize: "10",
          },
        };
      }),
    };
    let _option = {
      geo: {
        map: "china",
        zoom: 1.68,
        top: "31.5%",

        label: {
          show: true,
          fontSize: "8",
          color: "#28a7e1",
        },
        itemStyle: {
          borderColor: "#1085AC",
          areaColor: "#1a439a",
        },
        show: false,
        silent: true,
      },
      tooltip: {
        backgroundColor: "#0c1a4f",
        borderColor: "#2ca3ff",
        textStyle: {
          color: "#aaddff",
        },
        position: "right",
        className: "echarts-tooltip",
        triggerOn: "none",
        padding: [5, 10],
        fontSize: 12,
        formatter: function (params) {
          return params.name;
        },
      },
      series: [effect],
    };
    _myChart.setOption(_option);

    var index = 0;
    this.timeMap = setInterval(function () {
      _myChart.dispatchAction({
        type: "showTip",
        seriesIndex: 0,
        dataIndex: index,
      });
      index++;
      if (index > list.length) {
        index = 0;
      }
    }, 3000);

    let isOne = true;
    let gold = [];
    let changeMap = () => {
      let _kz = {};
      if (isOne) {
        isOne = false;
        api
          .post("A" + this.system + "010", { count: this.OrderNumber })
          .then((data) => {
            gold = data;
            _kz = {
              series: [
                effect,
                {
                  type: "scatter",
                  coordinateSystem: "geo",
                  symbol: jb,
                  symbolSize: 25,
                  data: gold.map((item) => {
                    return {
                      name: "1",
                      value: item,
                      itemStyle: {
                        normal: {
                          color: "#ffff00",
                          opacity: 1,
                        },
                      },
                    };
                  }),
                },
              ],
            };
            _myChart.setOption(_kz);
          }).finally(()=>{
            if (gold.length > 0) {
              this.timeMapOut = setTimeout(() => {
                changeMap();
              }, 3000);
            } else {
              isOne = true;
              this.timeMapOut = setTimeout(() => {
                changeMap();
              }, 5000);
            }
          });
      } else {
        isOne = true;
        this.changeMapData().then((data) => {
          _kz = {
            series: [
              effect,
              {
                type: "lines",
                symbolSize: 10,
                effect: {
                  show: true,
                  period: 1,
                  trailLength: 0,
                  symbol: jb_dh,
                  symbolSize: 25,
                  loop: false,
                },
                lineStyle: {
                  color: "#2d9df1", //航线的颜色
                  width: 1,
                  opacity: 0,
                  curveness: 0.2, //  弯曲程度
                },
                data: gold.map((item) => {
                  return {
                    fromName: "1",
                    toName: "金币",
                    coords: [item, [87.68, 51.77]],
                    value: [87.68, 51.77],
                  };
                }),
              },
            ],
          };
          _myChart.setOption(_kz);

          //更新计数
          setTimeout(() => {
            //播放音效
            if (this.isAudio) {
              this.audio.play();
            }
            this.OrderNumber = data;
            this.toOrderNum(this.OrderNumber);
            this.setNumberTransform();
          }, 1000);
        }).finally(()=>{
          this.timeMapOut = setTimeout(() => {
            changeMap();
          }, 5000);
        });
      }
    };
    this.timeMapOut = setTimeout(() => {
      changeMap();
    }, 5000);
  }
5、地图上的累计出函笔数计数效果实现:
这个效果就是手动实现的,没什么好的插件,
<li :class="{'number-item': !isNaN(item) }" v-for="(item,index) in orderNum" :key="index">
   <span v-if="!isNaN(item)">
    <i ref="numberItem">0123456789</i>
   </span>
   <span class="comma" v-else>{{item}}</span>
</li>


  // 订单滚动
  orderNum = ["0", "0", "0", "0", "0", "0"];
  OrderNumber = 823123;
  setNumberTransform() {
    let numberItems = this.$refs.numberItem; // 拿到数字的ref,计算元素数量
    let numberArr: any = this.orderNum.filter((item: any) => !isNaN(item));
    // 结合CSS 对数字字符进行滚动,显示订单数量
    for (let index = 0; index < (numberItems as any).length; index++) {
      const elem = numberItems[index];
      elem.style.transform = `translate(-50%, -${numberArr[index] * 10}%)`;
    }
  }

  // 处理总订单数字
  toOrderNum(num) {
    num = num.toString();
    // 把订单数变成字符串
    if (num.length < 6) {
      num = "0" + num; // 如未满八位数,添加"0"补位
      this.toOrderNum(num); // 递归添加"0"补位
    } else if (num.length === 6) {
      // 订单数中加入逗号
      this.orderNum = num.split(""); // 将其便变成数据,渲染至滚动数组
    }
  }
6、订单资讯这个用的是无缝滚动插件
npm i vue-seamless-scroll
7、成单率/活跃客户数量/近一年出函统计这些都是用的echarts现成的组件,改改颜色而已
总的来说,利用echarts实现难度不是很高,大部分效果都是echarts,吃透echarts就很简单
数据大屏这个看起来很难,实际操作没那么复杂,有一个设计师配合你,如果不是太酷炫的效果,都可以搞定